The National Hurricane Center’s iconic “cone of uncertainty” — the five-day track forecast graphic that’s been a fixture of cable news panic coverage since 2002 — is getting its first major redesign this summer. After two years of experimental testing and public feedback, the updated version debuts when the first tropical storm forms during the Atlantic hurricane season starting June 1.
The reason for the overhaul? Turns out people have spent two decades completely misunderstanding what the cone actually shows.
What Was Wrong With the Old Cone
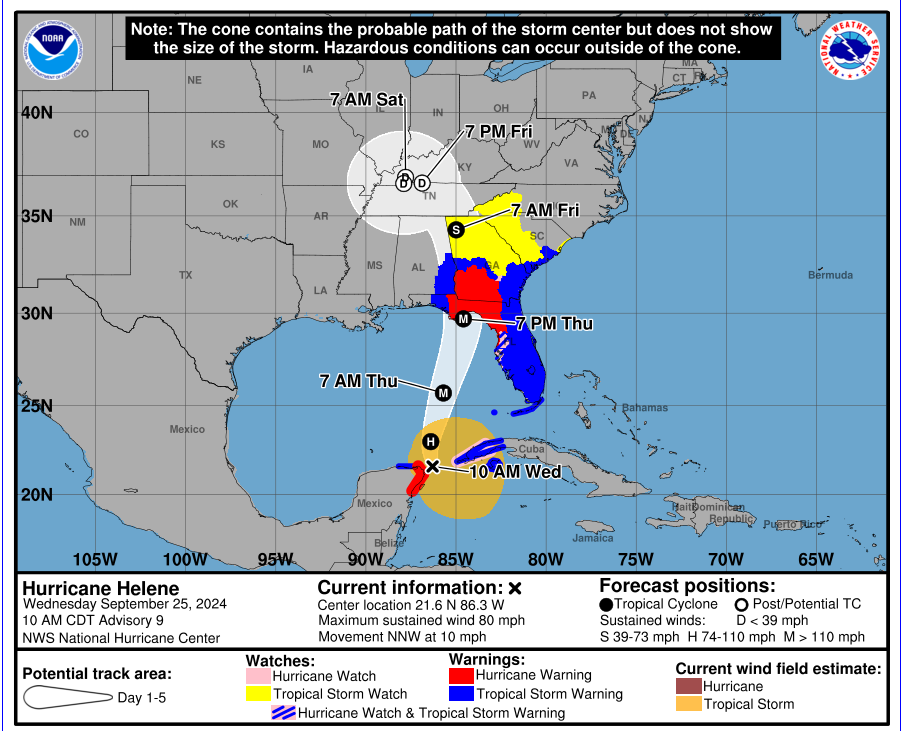
The original graphic showed only the likely path of the storm’s center — not its size, not the full range of impacts, not the areas getting hammered by wind and rain. It marked coastal zones under tropical storm and hurricane watches and warnings, but inland areas? Left off entirely.
So communities 200 miles from the coast would look at the cone, see themselves outside it, and assume they were safe. Then the storm would arrive — slower than forecast, tracking slightly east or west — and dump catastrophic rainfall on places that never saw it coming.
Michael Brennan, director of the hurricane center, told USA TODAY the goal is straightforward: “Better convey the wind risk, and better convey that hazards can extend outside the cone.”
The solution — add bright color-coded shading for all inland tropical storm and hurricane watches and warnings across the continental U.S., Hawaii, Puerto Rico, and the U.S. Virgin Islands. The new version will also be interactive, allowing users to zoom, pan, and save the image.
The Cone Was Never About Size—It Was About Probability
Robbie Berg, the hurricane center’s warning coordination meteorologist, explained the core problem: the cone was drawn using concentric circles to show where the storm’s center was expected to travel two out of three times, based on forecast errors from the previous five seasons.
A 67% probability zone.
“I don’t think people really understand that well,” Berg said. Many viewers interpreted it as the storm’s size, its impact area, or — worse — an absolute path rather than a probability range.
So the hurricane center is already testing another experimental version that swaps the circles for ellipses. Flattened ovals that better illustrate forecast errors both along the track and across it. And the new version uses a 90% probability threshold — meaning the storm’s center should stay within the cone nine out of ten times.
Why ellipses? The hurricane center consistently makes larger errors in predicting a storm’s speed than in predicting its lateral movement. Berg compared it to using GPS for a road trip — you generally stay on the route with minor detours, but your arrival time can shift dramatically depending on traffic.
“If the forward speed is off by only 5 knots over 120 hours, that’s a much larger displacement between when the storm was forecast to arrive and when it actually arrives,” Berg said.
The Cone Is Just a Table of Contents
John Cangialosi, a senior hurricane specialist, put it bluntly: impacts always fall outside the cone. “The bottom line is we keep telling people you can’t use this one alone. We need you to focus on the whole big picture.”
Berg echoed the point. “The cone is like a Table of Contents. That’s all it is. You don’t get a full story just by reading the table of contents. You have to actually look at other products to understand more about the risk.”
The hurricane center is also rolling out its first storm-surge watches, warnings, and peak-surge forecasts for Hawaii this year. Cody Fritz, the center’s storm surge unit lead, said the fixation on the track’s center has caused people to ignore hazards hundreds of miles away from it.
A Continual Improvement Process—Finally
Berg emphasized the hurricane center isn’t making one change and sitting on it for another 20 years. “We want to be constantly making updates and new changes.”
Which is probably the most reassuring part of this whole story. Not that the cone is finally getting fixed — but that the people responsible for it have accepted that communication is an iterative process, not a one-time design problem.
The new cone won’t stop cable news anchors from treating every tropical depression like an extinction event. It won’t prevent people from panic-buying bottled water in landlocked counties. But it might — just might — help a few more communities understand that the storm doesn’t care whether you’re inside the cone or not.
The hazards show up where they show up. The cone just gives you odds.
For Those Of You Keeping Score At Home, Here Is a List Of the 2026 Named Storms
Arthur
Bertha
Cristobal
Dolly
Edouard
Fay
Gonzalo
Hanna
Isaias
Josephine
Kyle
Leah
Marco
Nana
Omar
Paulette
Rene
Sally
Teddy
Vicky
Wilfred